DAP-seq (DNA affinity purification sequencing) uses affinity-purified transcription factors to identify binding sites in genomic DNA. The method is faster, cheaper, and more scalable than other methods like ChIP-seq.
The network viewer is a powerful tool that allows users to explore the relationships between transcription factors (TFs) and their target genes. It is a graphical representation of the regulatory network, where each node represents a TF or a target gene, and the edges represent the regulatory interactions between them. The network viewer can be used to identify key regulators, understand the relationships between different transcription factors and target genes.
Check these references for more information about DAP-seq:
Using the MycoCosm/PhycoCosm main page, navigate to the DAP-Seq tab, reset the zoom level to 100% and make sure you are using the latest Chrome web browser to ensure full compatibility. Depending on the device and operating system you are using, you can adjust zoom level using ctrl and the + - buttons on the keyboard or on MacOs replace the ctrl with the ⌘ button.
The network will be automatically loaded, and will represent either data from a single DAP-seq study, or a combination of DAP-seq/ChipSeq experiments. The initial layout may not be the most optimal, and you can activate the “Start Layout” button to start the layout algorithm based on the force-directed approach of Kamada and Kawai (1988).. You can stop the layout process when you are satisfied with the layout by using the “Stop Layout” button . This process can be started and stopped anytime at will, in order to optimize the network view.
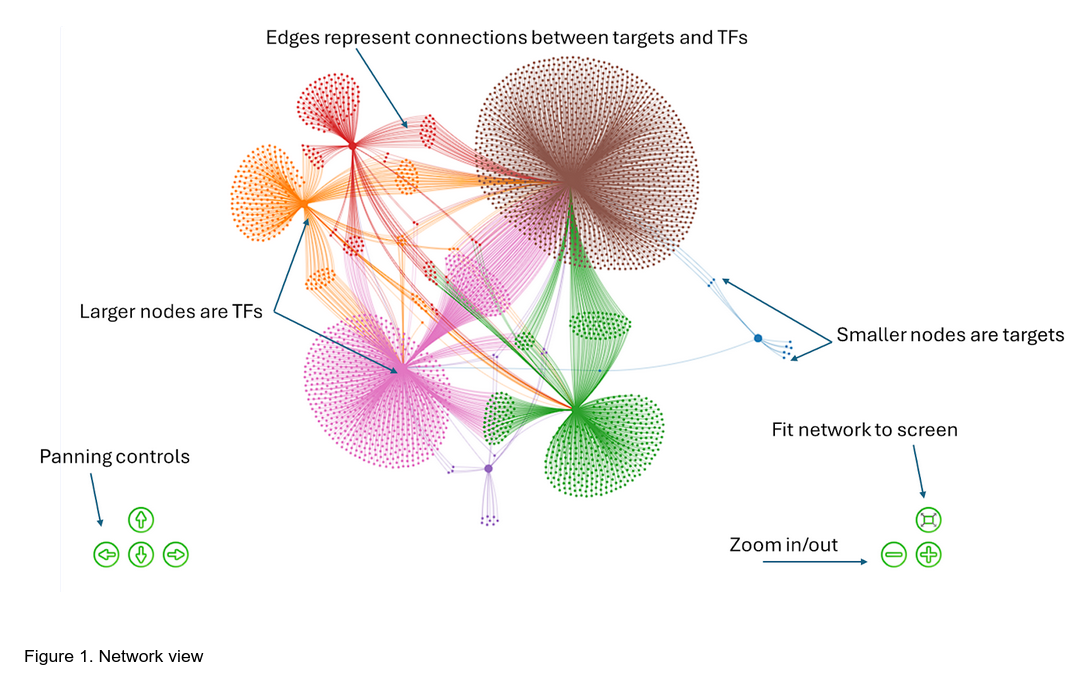
In the rendered network, larger nodes represent TFs, smaller nodes represent target genes, in proximity of which the TF binds DNA. The edges are connections between target genes and TFs. Multiple TFs can be connected to the same target gene, and TFs can be connected to other TFs including themselves (self loops).
The colors representing major neighborhoods (clusters) in the network are generated using the Louvian clustering algorithm. The colors mean these nodes are members of the same community within the regulatory network and likely share the same set of connections as each other.
The network can be dragged around by clicking on the network and not releasing the mouse button while moving the mouse. The nodes are clickable. Zooming can be done using the controls on the screen or using the mouse wheel. When clicked each node will show its information in the “Gene Information” panel on the right; click on the node information to linkout to the protein page for the particular organism. Note that the position of this panel might differ slightly based on your screen size.
To search for specific information in the network, for example keywords from the annotations of the targets use the search panel on top of the network view
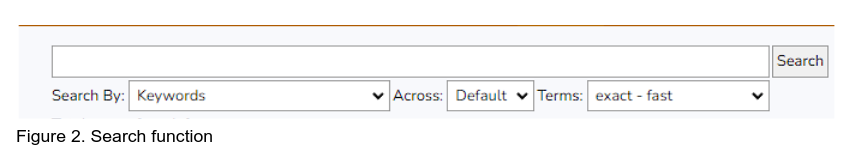
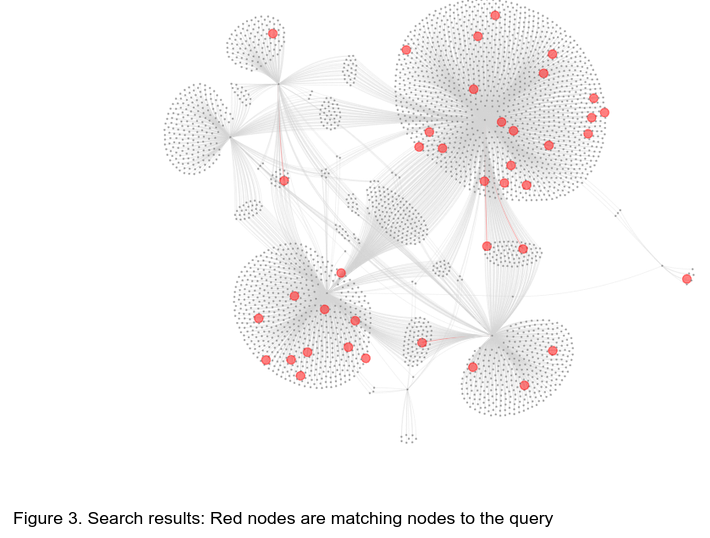
Keywords such as “zinc” can be used for example to find zinc transporter or zinc finger proteins on the network. The search results will be displayed in the results panel (TBD). The network view will change colors to highlight the found nodes in red (Figure 3). The dropdown menus “Search By”, “Across”, “Terms” can be used to narrow down or expand your search strategy similar to functionality on the MycoCosm/PhycoCosm search page.
To return to the original layout colors, simply erase the search keyword and press enter, or use the “Reset Layout” Button to completely reset the view to the original setting.
Sometimes regulatory networks can be very dense and hard to navigate, resembling a “hairball”. The “Prune Network” button can be used to compress the network to explore some of the more intrinsic aspects of the network without the single-edge leaf nodes (Figure 4). After pruning, activate the start layout and stop layout procedure as described above.
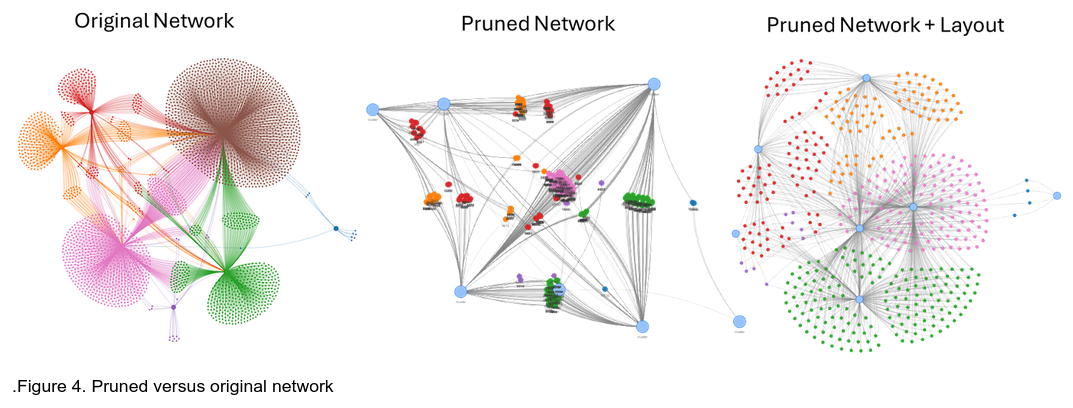
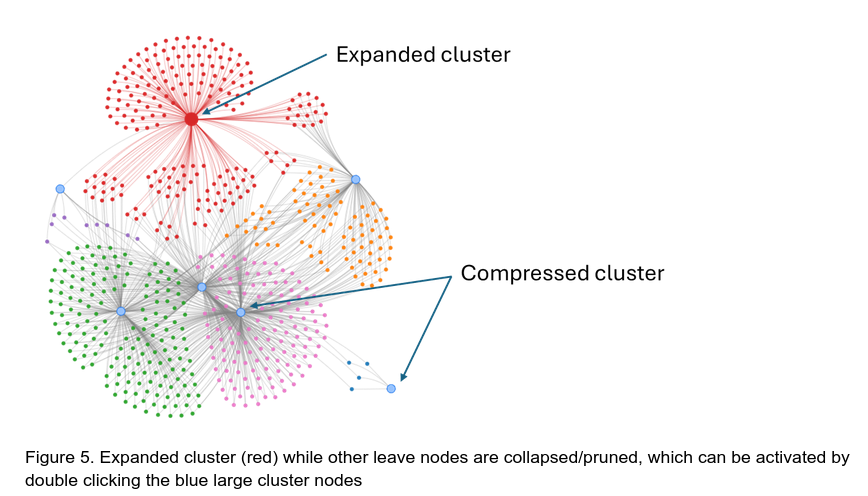
A new set of large blue nodes will appear, each of these nodes representing a clustered set of nodes from the previous network. In most DAP-seq data this roughly corresponds to the main TF hubs in the network.
To expand the pruned nodes, double click the blue nodes on the pruned network, the layout algorithm will be activated for a few seconds and will stop on its own. Further layout improvement can be made by activating the layout algorithm manually as described above.
The current network view can be exported anytime using the “Export Image” button . The file will be downloaded automatically as a png file. Note that the background of the network image is transparent.