Introduction
Protein Browser used to display lists of proteins. It used as a mean to navigate over specific models (proteins) linked from annotations browser. Same screen used for all types of annotations. It consist of table view and table navigation ba.
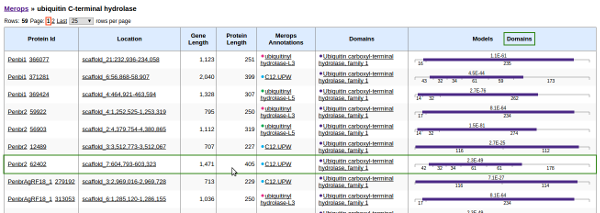
Table
Table display protein detains information.
Columns
- Protein Id; display portal ID (species/stain) and protein ID for given protein withing the species. Portal ID ha 'hover'
function, shows full species/strain name when cursor hovered over the portal ID. Portal ID linked to the corresponding portal.
Protein ID linked to the detail page for given protein.
- Location; display model location in genomic coordinates (scaffold, start, end - both numbers inclusive).
Linked to the genome browser page on given location.
- Gene Length; length of the model in genomic coordinates (on scaffold) in nucleotides
- Protein length; length of given protein, in amino acids.
- Annotations; display list of corresponding annotation keys, specific type of annotations could vary, depending from where you
came from to the page. Th the moment it could be CAZY or MEROPS annotations. Annotations has hover function. It may be
linked to the web page that corresponds to given annotation.
- Domains; shows list of PFAM domain associated with given protein.
Linked to the xfam.org page for given domain and has hover.

Model Structure
Models structure column shows intron/exon structure of the model. Exons are shown as pink bars, numbers display intron/exon length in nucleotides.

Domains Structure
Domains structure shows location of domains within protein. It also shows exon segments with length of each segment in amino acids. Numbers on top of the domain show e-value for given domain.