Help Home > Clustering > The Clusters Front Page
![]()
- Clustering Front Page
- Cluster Details Page
- Phylogenetic Cluster Reconstruction
The Clusters Front Page
1. Run Selection
Clustering analysis begins by selecting a Run and clicking Go.

Below the run selection box a table displays information about the selected run, including the number and size-distribution of computed gene families in the run.
2. The Clusters Table
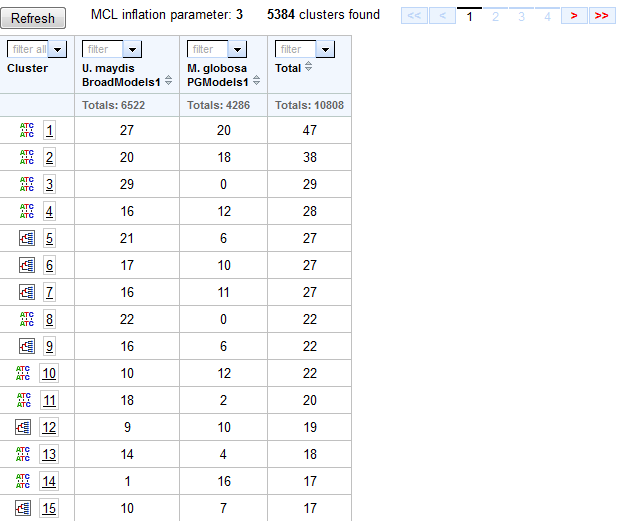
The list of clusters appears in a table in which each cell represents the number of gene models that each organism (column) contains for each cluster (row).

- The cluster id for each cluster (row) is given in the first column of the table. Click on this number to visit the Cluster Details page for this cluster.
- Icons to the left of the cluster id indicate the availability of a phylogenetically reconstructed gene tree for each cluster, as shown below.
Click on this icon to see the alignment/gene tree page for this cluster.
A multiple alignment is available for this cluster, as well as a species-reconciled gene tree. A multiple alignment is available for this cluster, but it was not possible to generate a species-reconciled gene tree. - (No icon) Alignment data is not available for this cluster.
- The label for each column shows the organism name as well as the feature track used as input to the clustering run.
- Clicking on a genome/track name will sort the table according to the cluster representation (number of members) for that organism/track
- The filter pull-down menus in each column header allow you to filter clusters by cardinality. This is described below in Organism Filters.
3. Gene Search and filtering
You can narrow down this list to find gene families of interest in one of two ways: by Gene Search or by using Organism Filters, as is described below.
3.1 Gene Search

Locate the cluster containing a specific gene model by selecting a genome in the run, specifying a JGI proteinID, and clicking Search in the dialog shown below:
3.2. Organism Filters

Use filters to explore the gene family expansions and contractions across the genomes in the run. Using the pull-down menu shown below, select 0, 1, or 1+, for each genome to show only clusters that have the corresponding number of members for that organism. Then press Refresh to update list of clusters.
To set the filter to 0, 1, or 1+ for all organisms in the run, use the filter pull-down above the Cluster title in the top left of the table.
4. Exploring an individual cluster
To view the gene models contained in a particular cluster, click on the number of that cluster in the Totals column. This will bring you to the Clustering Details Page, which displays information about the selected cluster.
