|
Help Home > The Genome Browser > The Genome Viewer
The Genome Viewer |
|
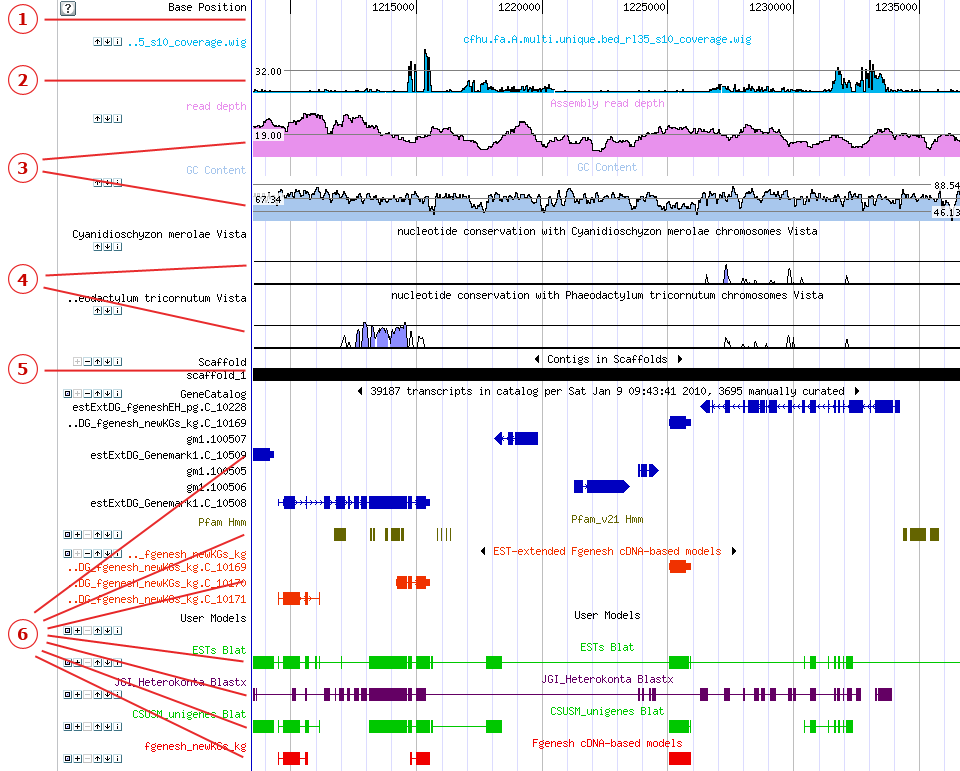
The Genome Viewer displays tracks (colored, horizontal rows of sequence data) that represent the scaffold, JGI-predicted genes (gene models), and other relevant sequences, all aligned by base position. Each track is shown in a specific color and with an identifying label. Tracks in the Genome Viewer are displayed from top to bottom in the following order In addition to displaying tracks, the Genome Viewer allows annotators to create and edit gene models .
1. The Base Position TrackBeneath custom tracks in the Genome viewer you will see the Base Position track, showing the nucleotide base position along the scaffold. The Base Position track operates as the horizontal scale of the Genome viewer. To center the Genome Viewer on a specific nucleotide, click the Base Position track at the desired position. Centering behavior is determined by the Recenter Options setting in Browser Options in the Browser toolbar. 2. Custom TracksThe top-most tracks in the Genome viewer are Custom Tracks displaying data uploaded by JGI users. Click here to learn about how to upload, manage, and share custom tracks, including Wiggle tracks. 3. Curve TracksAppearing below the Base Position track, Curve tracks are colored line-graphs that display three different types of information:
4. Vista Tracks
5. The Scaffold TrackThe scaffold under observation in the Genome Viewer is represented by the Scaffold Track, a black and red bar underneath the curve tracks. When viewed in full mode (the default), black areas indicate contigs, and red lines or rectangles indicate gaps. The track label shows the scaffold number (e.g., "Scaffold_1"). Small gaps may not be evident when zoomed out. When zoomed in to a shorter range on the browser, the scaffold track also includes the 3-frame amino acid translation (AA) or at a closer range, the 3-frame amino acid translation with nucleotide bases (NA). 6. Feature TracksThe majority of the tracks in the Genome Viewer represent collections of features. Quick Tips: What is a Feature?
Display and manipulation of feature tracksTracks can appear in one of three viewing modes with respect to how features are displayed: full (or "expanded"), condensed, or packed. To the left of the label for each track, a set of icons allows the user to select among theses modes and to shift the position of the track up and down in the browser window:
Tracks can also be switched between full and collapsed modes by clicking on the label that appears above each track, or by using the Browser Toolbar. When visible (when viewed in pack or full mode), features are shown as rectangles joined by lines, with arrowheads indicating the read direction of the feature. Quick Tips
Previous/Next arrowsWhen you expand a track, the track label will include black arrows to the left and right of the label name (as shown in the image above on either side of "Contigs in Scaffolds"). These arrows allow you to navigate to the previous and next features for the current track and on the current scaffold/chromosome only. The left-side arrow moves you to the previous feature, and the right-side arrow moves you to the next feature. The previous or next track feature will be centered in the browser along with a 20% padding on each side, causing the zoom to automatically adjust. If you are currently viewing the first feature in a track, using the previous feature icon will result in recentering around the same feature. Similarly, using the next feature icon when viewing the last feature in a track will cause the browser to recenter around the same feature. Quick Tips
Gene Model TracksJGI-predicted genes appear in a track below the scaffold track, usually labeled "Gene Models" or "Filtered Models." User-created gene models may be shown further down the list of tracks. On Gene Model tracks, each feature represents a single gene model. Rectangles represent exons, and the connecting lines represent introns. Quick Tips
Loci TracksFor some organisms, loci are shown in a "Loci" track. Each feature in such a track represents a locus. To view the annotation area for a locus, click the Loci track to expand it to full mode, then click the feature row for the locus of interest. Nucleotide/Alignment TracksTracks for nucleotide sequences are shown below the gene models. These can for include, for instance, ESTs, clones, reads, PFAM domain alignments or BLAT or BLAST data for related organisms. On nucleotide tracks, each feature generally represents an alignment. Rectangles represent high-scoring pairs (HSPs), and connecting lines represent gaps in the alignment. Repeat TracksIn repeat sequence tracks (usually shown in black near the bottom of the screen), each feature represents a repetitive region on the scaffold. Quick Tip
Other Feature TracksOther tracks may describe the location of SNPs, user-loaded features, or other data along the scaffold. |