Help Home > Alignment Search > Viewing Alignment Results > Viewing Hit Graphs
The Hit Graphs Panel
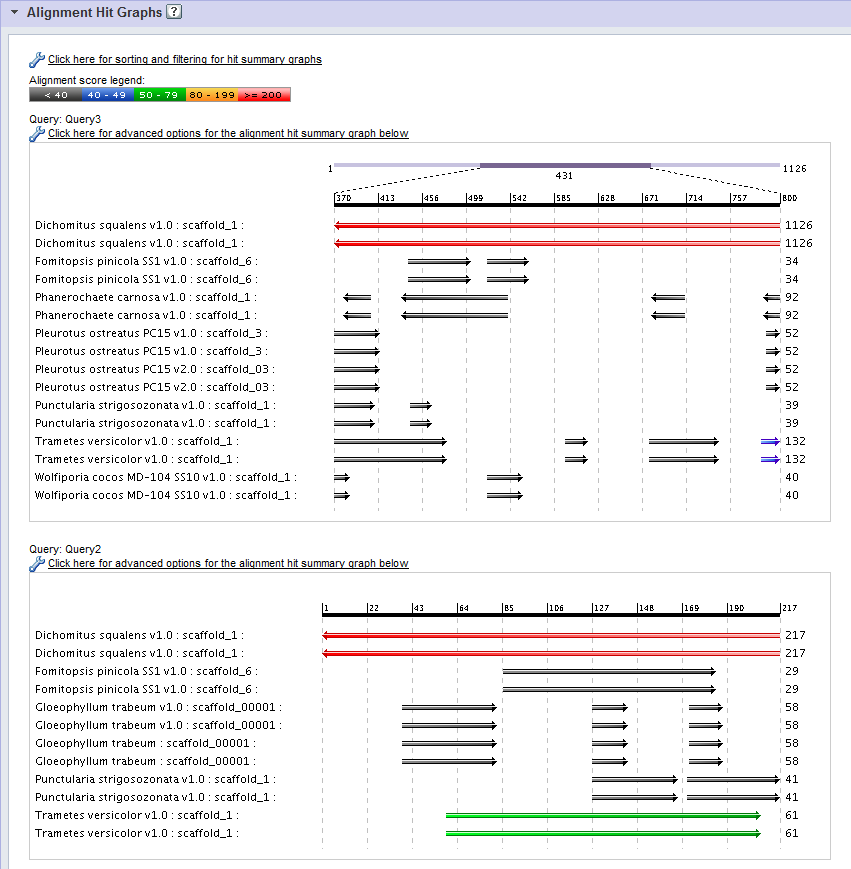
Alignment Hit Graphs provide a visual representation of how hits are distributed across each of the query sequences in your run.
Interpreting the Alignment Hit Graph

- The black bar along the top of the graph represents the position within the query sequence, which serves as the x-axis.
- A single hit is shown along each row of the graph, labeled by:
- The organism name.
- The target database, in parentheses.
- The scaffold, chromosome, or contig name.
- Each hit is displayed as a set of block arrows representing High-Scoring Pairs (HSPs) aligned to the corresponding position in the query sequence. A forward pointing arrow indicates that that the HSP aligns with the forward strand in the target scaffold, while a backward pointing arrow indicates an opposite-stranded alignment.
- The color of each block represents the alignment score for the corresponding HSP, as is indicated by the Alignment score legend at the top of the Alignment Hit Graph Panel.
- Numbers down the left-hand side of the graph represent the hit alignment score .
Sorting and Filtering Hit Graphs

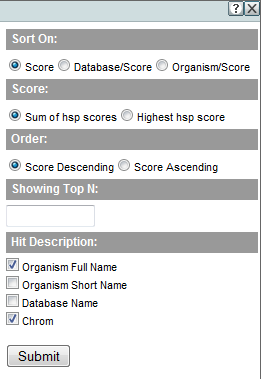
Click on Sorting and filtering for hit summary graphs to open a dialog that allows you to:
- Sort the rows of the hit graph by (1) score, (2) target database first, and then score, or (3) organism first and then score.
- Order the selected sort in descending or ascending order.
- Limit the graph to the just top N hits, based on the selected sort criteria and ordering.
- Select which attributes of the hit will be included in Hit Graph labels.
These settings will apply to the every hit graph displayed in the Alignment Hit Graphs Panel.
Controls for Individual Hit Graphs

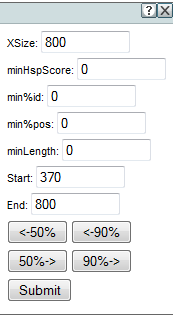
Click on Advanced options for the alignment hit summary graph below to adjust display settings for an individual hit graph:
- Xsize The width of the result image in pixels. The scale adjusts to fit the full query sequence into the image.
- minHspScore The minimum alignment score a high-scoring pair must have to be shown. (A higher number gives you fewer hits.)
- min%id The minimum percentage identity a hit must have to be shown.
- min%pos The minimum percentage of positives (identical or similar matches) a hit must have to be shown.
- minLength The minimum alignment length in base pairs a hit must have to be shown.
- Start The start of the shown portion of the query sequence. If this number is higher than the actual start of the query sequence, you can use the navigation buttons, described below, to jump toward the start or end.
- End The end of the shown portion of the query sequence. If this number is less than the actual end of the query sequence, you can use the navigation buttons to jump toward the start or end.
- Navigation Buttons Use the navigation buttons to jump towards the start or end of the query sequence by 50% or 90% of the shown sequence length.
- Submit Press Submit to apply the selected changes to the hit graph.
The Scaffold Window

Above the black query sequence bar in a Hit Graph you will see a grey bar representing the entire length of the query sequence. A darkened segment of this bar represents the "scaffold window", the section of the query sequence currently under observation in the graph. The length of the window in bp is indicated below the darkened segment.
The scaffold window can be adjusted by using the navigation buttons or changing Start or End in the Advanced options for the alignment hit summary graph below controls described above.
Activating the Hit Details Panel


