
Help Home > Alignment Search > Viewing Alignment Results > Viewing Hit Details


 The Hit Details Panel
The Alignment Results Page: The Hit Details Panel
Anatomy of the Hit Details Panel
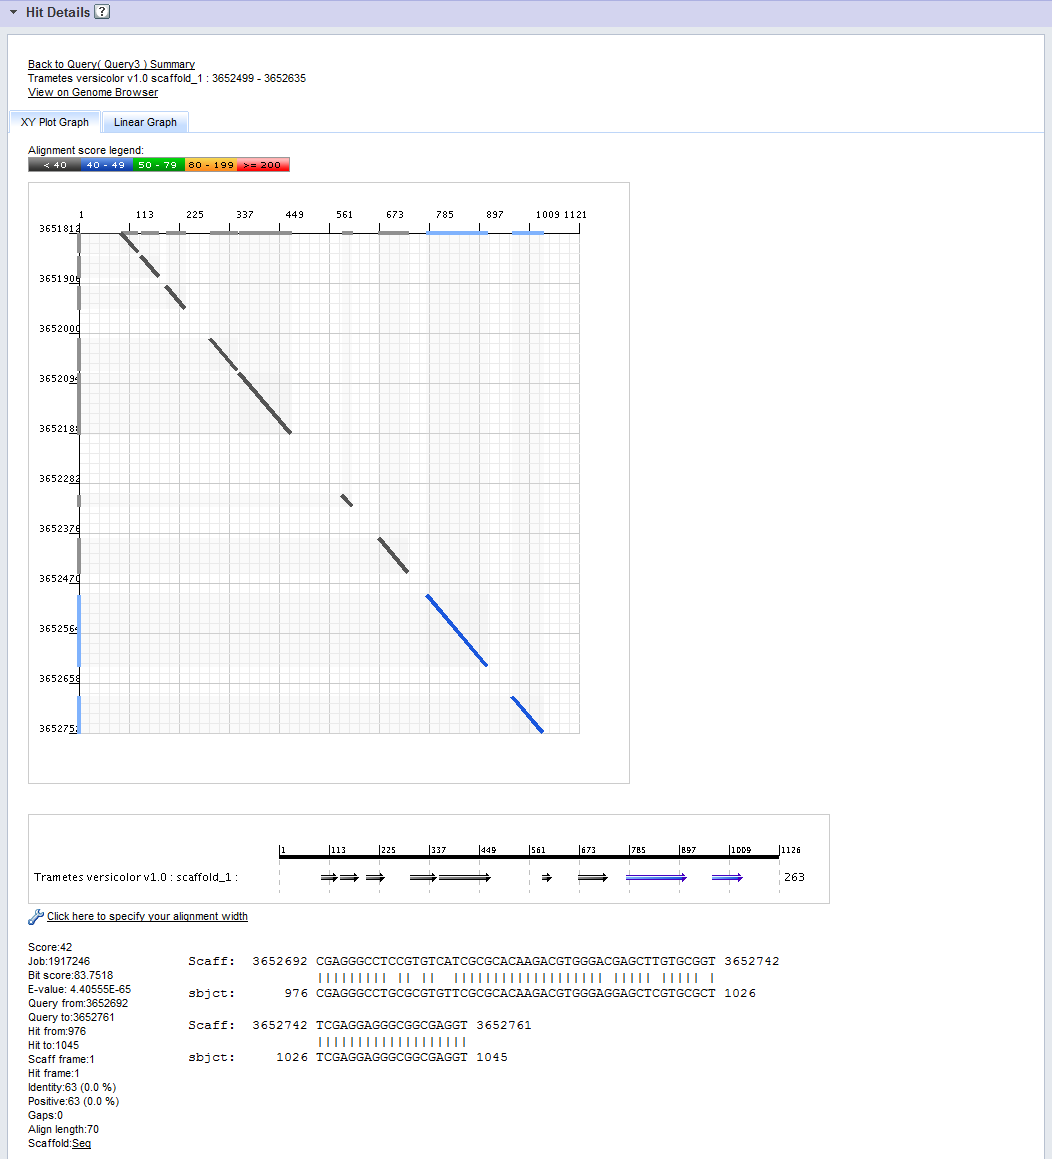
The Hit Details Panel allows you to drill into an individual BLAST hit for further analysis. The hit is selected by click on a row of a Hit Graph in the Hit Graphs Panel. The Hit Details Panel is organized into five sections, as indicated in the figure below.
- Links to:
- View the The Query Summary, that is, the Hit Graph for the selected hit.
- View on Genome Browser: View the hit target on the JGI Genome Browser.
- The XYPlot Graph.
- The Linear Graph.
- The row from the Hit Graph for the selected hit.
- The Sequence Display.
The XYPlot Graph
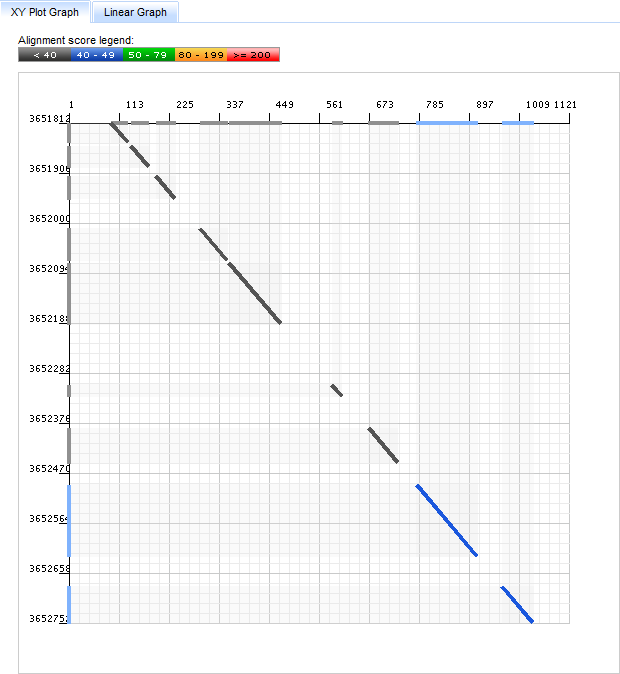
In the XYPlot Graph the two axes represent position along the query sequence (the x-axis) and position on the target scaffold (the y-axis).
Each segment of the hit (each "High Scoring Pair" or HSP) is shown on the graph as a line connecting points of alignment between query and target sequences. The color of the line segment shows the alignment score of the corresponding HSP, as indicated by the Alignment Score Legend.
Bars along the X and Y axes show the projections of each HSP along the query and target scaffolds, respectively.
The Linear Graph
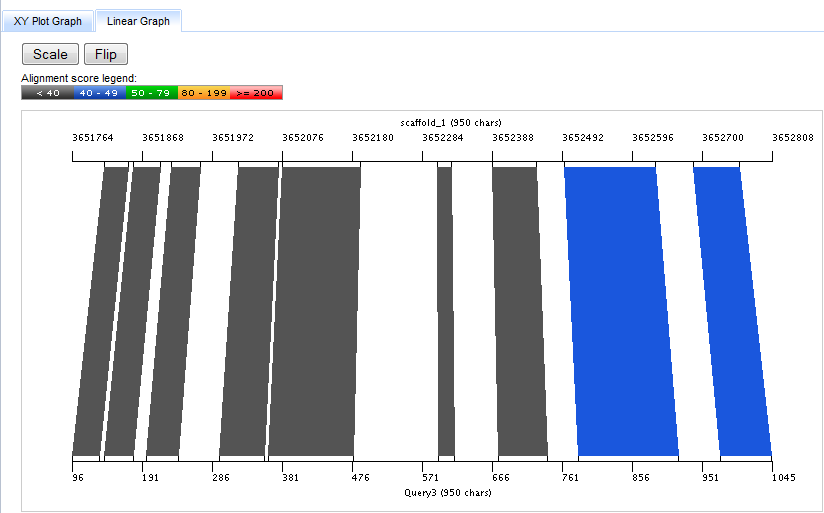
The Linear Graph depicts the hit as connected regions between two lines representing the target (top) and query (bottom) sequences.
These regions are colored by score as in the XYPlot Graph.
Pressing the Scale button toggles between two modes for setting the screen pixel to base pair ("pixels/bp") scale on the Linear Graph. In the default mode, the pixels/bp scales are set differently for the target and query sequences so as to use the entire width of the graph for each side of the alignment. In the "scaled" mode, the pixel/bp ratio is set identically for target and query sequences so that the relative size of the aligned segments are more readily apparent, even if this does not optimize use of the screen.
The Flip button toggles the strandedness of the query sequence between forward and reverse directions.
The Alignment Sequence
This Alignment Sequence display shows you data for each of the BLAST or BLAT high-scoring pairs (HSPs) along with a pairwise alignment report from the BLAST or BLAT result.
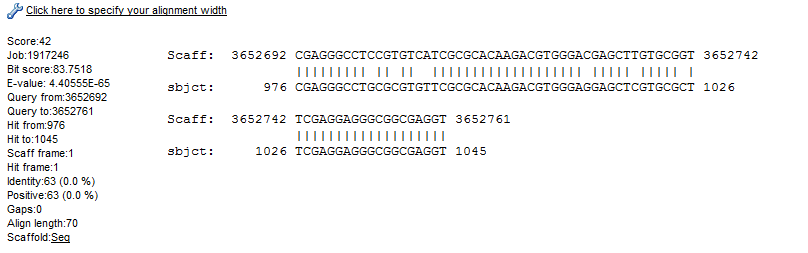
Depending on the alignment program, this data might include:
- Hsp_num The high-scoring pair number, within the alignment.
- Score The score for the HSP.
- Bit Score The bit score for the HSP.
- Evalue The E-value for the HSP.
- Query from The number of the first base in the alignment along the scaffold.
- Query to The number of the last base in the alignment along the scaffold.
- Hit From The number of the first base in the alignment along the hit sequence.
- Hit To The number of the last base in the alignment along the hit sequence.
- Scaff frame The reading frame of the scaffold.
- Hit frame The reading frame of the hit sequence.
- Identity The number (and percentage) of identical bases or amino acids in the alignment.
- Positive The number (and percentage) of positive, or conservative, matches (not including identities) in the alignment.
- Align length The alignment length of the HSP.
- Gaps The number of gaps in the alignment.
- Scaffold Seq A link to the scaffold genomic sequence for the HSP.
For more information on these terms consult the references listed here.
Click on Specify Alignment Width to set the number of bp displayed per line of each alignment.